Visualising OBS Streaming Stats
Visualising OBS Streaming Stats
In these days of home working, more and more people
are streaming on Twitch, YouTube, LightCast, Mixer, etc. One of the most
popular platforms for doing this is Open Broadcast Software (OBS). OBS has some
real-time statistics, such as CPU usage in its taskbar, but it doesn’t have any
mechanism for storing these metrics, extending them, or combining them in a way
to gain insights.
 Streaming services can provide a summary of
statistics over the length of a stream, but those are server-side, and can’t report
on local resource usage or settings. What if there was a way of visualising
real-time streaming stats from OBS itself?
Streaming services can provide a summary of
statistics over the length of a stream, but those are server-side, and can’t report
on local resource usage or settings. What if there was a way of visualising
real-time streaming stats from OBS itself?
I use InfluxDB as my main visualization engine, so
I was looking for a way to get statistics from OBS that I could send to
InfluxDB. I wanted to get something like frames-per-second, Mbps transmission
rate, dropped frames, etc.
OBS has no built-in API for doing this, but there
is a downloadable plug-in called "OBS-websocket" https://obsproject.com/forum/resources/obs-websocket-remote-control-obs-studio-from-websockets.466/
This plug-in claims to be for controlling and
managing OBS facilities via a WebSocket API, but it also outputs data.
I downloaded it and looked for some way of
attaching to the WebSocket API. NodeRED came to my rescue, as it often does,
and so I added a WebSocket client node to read the OBS-websocket port on my PC
(port 4444 by default).

Whenever I performed an action in OBS, such as
swapping scene, starting / stopping recording or streaming, altering
transitions, modifying sources, etc. I saw some messages being reported. Messages
such as:
{
"duration": 300,
"from-scene": "Scene 2",
"name": "Fade",
"to-scene": "Scene",
"update-type": "TransitionBegin"
}
{
"scene-name": "Scene",
"sources": [
{
"cx": 743.0,
"cy": 418.0,
"id": 5,
"locked": false,
"name": "Snapcam",
"render": false,
"source_cx": 1280,
"source_cy":
720,
"type": "av_capture_input",
"volume": 1.0,
"x": 0.0,
"y": 0.0
},
{
"cx": 1122.0,
"cy": 631.0,
"id": 4,
"locked": false,
"name": "webcam",
"render": true,
"source_cx": 1280,
"source_cy": 720,
"type": "av_capture_input",
"volume": 1.0,
"x": 0.0,
"y": 419.0
},
{
"cx": 1695.0,
"cy": 1129.0,
"id": 3,
"locked": false,
"name": "Image",
"render": true,
"source_cx": 500,
"source_cy": 333,
"type": ...
{
"update-type":
"RecordingStarting"
}
{
"rec-timecode": "00:00:00.000",
"update-type": "RecordingStarted"
}
{
"rec-timecode": "00:00:01.999",
"update-type": "RecordingStopping"
}
{
"update-type": "RecordingStopped"
}
The messages are all JSON. None
of them have a timestamp, and none of them indicate the host against which they
are monitoring. But they all include “update-type”. An update-type of “StreamStatus”
would indicate real-time stream statistics.
In NodeRED, JSON messages received
by the WebSocket listener node can be inserted as text into the “msg.payload”
object, in which case they are readable as shown above, or they can be inserted
into the complete message object, in which case all the JSON properties are
exposed and can be acted upon. Therefore, I did a couple of things:
·
I added a
node to add timestamp and hostname to the incoming message.
·
I swapped
to “complete msg” mode, and created a switch to grab only the “StreamStatus”
object.

My end-game of this is to output
to InfluxDB. I use Telegraf as my main InfluxDB ingest tool, but Telegraf does
not currently include a WebSocket listener. No problem – I can send my captured
messages from NodeRED to somewhere that Telegraf can read them.
I want to send the message
payload, so I’ll need a function node to put the JSON message in the right
context.

OBS-websocket sends a message every
2 seconds during a live stream, so I can’t have a simple HTTP connection. I’ll
need something that works in a more streaming mode. I already use MQTT for
other message-based routines, so I’ll publish to that.

On the Telegraf end, I want to subscribe
to MQTT messages on obs/StreamStatus, translate the JSON message into
measurement, tags, fields & timestamp, and forward to InfluxDB. For the “StreamStatus”
update-type in the OBS-websocket API It looks like this:
[[inputs.mqtt_consumer]]
servers =
["tcp://192.168.1.17:1883"]
## Topics
that will be subscribed to.
topics =
["obs/StreamStatus"]
data_format
= "json"
json_strict
= true
json_query
= ""
tag_keys =
[
"preview-only",
"recording",
"recording-paused",
"replay-buffer-active",
"streaming",
"hostname"
]
json_string_fields = [
"rec-timecode",
"stream-timecode"
]
json_name_key = "update-type"
json_time_key = "timestamp"
json_time_format = "unix_ms"
json_timezone
= "UTC"
So this should be sending data to
InfluxDB during a live stream. What does InfluxDB actually receive? Quite a lot!

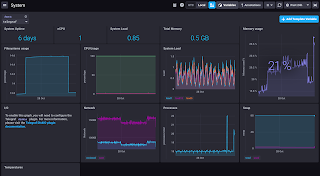
Creating a quick set of visualizations,
I can see all this data:

If we dive into these, what do
they all mean?
Window aggregates for all cells
were changed to “2s”, to match the transmission rate from OBS-websocket, so as
to query raw data.
Bucket name was changed to a
variable, to assist in creating a template from this if appropriate.
Hostname was changed to a
variable, so I can view the streaming stats of different PCs on my LAN by a
simple selection.
Frame Time is a direct query of “average-frame-time”,
and it would be the time OBS takes to render a frame?
Transmission Rate is a query of “kbits-per-sec”,
divided by 1024 for Mbps
CPU usage is a direct query of “cpu-usage”
FPS is a direct query of “fps”
Frames is a query of “num-total-frames”
and “output-total-frames” and “render-total-frames”, put through a non-negative
derivative function to change them from cumulative counters to values per
second, so show a more in-depth view of frames per second.
RAM used is a direct query of “memory-usage”
Stream Problems is a query of “num-dropped-frames”
and “output-skipped-frames” and “render-missed-frames” and “strain”, filtered
through a non-negative derivative function to change them from cumulative
counters to values per second, to indicate any problems with generating and transmitting
the stream at the requested bit-rate and quality.
Conclusions:
I don’t have an immediate use for
this data, although it’s interesting to see that OBS released 100MB of RAM,
about an hour into the stream. It’ll be worthwhile repeating the exercise for future
streams, to monitor stream quality and resource usage over time. I’m monitoring
many aspects of all the machines on my LAN, so I’ll be able to add operating system,
GPU, and network bandwidth stats if they’ll be insightful.
Comments
Post a Comment