Using A Telegraf Gateway
All my servers and sensors will be visualized in InfluxDB. They can all write directly into my local instance of InfluxDB OSS, but I also want to be able to write to remote instances, such as Influx Cloud. To do this, there are some limitations:
If I can collate all my updates into one place, all the adminitration of the points above goes away.
Therefore, having an interstitial instance of Telegraf, a Telegraf Gateway, is a good solution. I'll need to do some things:
So, I need to create a configuration for my telegraf gateway.
Telegraf reads default configurations from /etc/telegraf/telegraf.conf and /etc/telegraf/telegraf.d/filenames.conf, so let's create these:
/etc/telegraf/telegraf.conf
/etc/telegraf/telegraf.d/influxdb_listener.conf
/etc/telegraf/telegraf.d/socket_listener.conf
/etc/telegraf/telegraf.d/outut_influxdb.conf
As this is a LXC container, and I want to monitor all my containers, I should add a set of OS monitoring configurations. I shouldn't enable SMART monitoring or temperature monitoring, as those should come from the underlying server on which I'm running the container
/etc/telegraf/telegraf.d/cpu.conf
/etc/telegraf/telegraf.d/disk.conf
/etc/telegraf/telegraf.d/internal.conf
/etc/telegraf/telegraf.d/kernel.conf
/etc/telegraf/telegraf.d/mem.conf
/etc/telegraf/telegraf.d/net.conf
/etc/telegraf/telegraf.d/processes.conf
/etc/telegraf/telegraf.d/swap.conf
/etc/telegraf/telegraf.d/system.conf
So now Telegraf will write to all three of my outputs, collating data from all three of the types of input I have (Telegraf, HTTP custom endpoint, UDP).
This is what it looks like in Chronograf, showing a system view:
- Influx Cloud can only accept HTTP ingest. Any UDP messages will be dropped before they get through the Internet
- Usernames and passwords might change, so I will need to edit every Telegraf configuration file on every machine on my LAN
- Access tokens might change over time (especially as I migrate to Influx Cloud v2), so I will need to edit every Telegraf configuration file on every machine on my LAN
- Cloud services might be protected by IP address, so I might need to open multiple holes in firewalls.
- If I write to InfluxDB with anything other than Telegraf, I will need to worry about batching them myself, adding jitter to decrease the possibility of LAN overload, etc.
If I can collate all my updates into one place, all the adminitration of the points above goes away.
Therefore, having an interstitial instance of Telegraf, a Telegraf Gateway, is a good solution. I'll need to do some things:
- Install a container for Telegraf
- Enable telegraf inputs for UDP & HTTP
- Enable telegraf outputs for wherever I'll be writing my data
So, I need to create a configuration for my telegraf gateway.
Telegraf reads default configurations from /etc/telegraf/telegraf.conf and /etc/telegraf/telegraf.d/filenames.conf, so let's create these:
/etc/telegraf/telegraf.conf
 [global_tags]


 [agent]

  interval = "10s"

  round_interval = true


  metric_batch_size = 1000

  metric_buffer_limit = 10000


  collection_jitter = "3s"


  flush_interval = "10s"

  flush_jitter = "5s"


  precision = ""


  debug = false

  quiet = false

  logfile = "/var/log/telegraf/telegraf.log"

  logfile_rotation_interval = "0d"

  logfile_rotation_max_size = "1MB"

  logfile_rotation_max_archives = 5


  hostname = ""
/etc/telegraf/telegraf.d/influxdb_listener.conf
 # Influx HTTP write listener

 [[inputs.influxdb_listener]]

  service_address = ":8086"


  read_timeout = "10s"

  write_timeout = "10s"


  max_body_size = "500MiB"


  max_line_size = "64KiB"


  database_tag = "bucket_name"
/etc/telegraf/telegraf.d/socket_listener.conf
 [[inputs.socket_listener]]

  service_address = "udp://:8089"
/etc/telegraf/telegraf.d/outut_influxdb.conf
 # Local InfluxDB

 [[outputs.influxdb]]

  urls = ["http://ip_address_of_local_InfluxDB_server:8086"]

  database_tag = "bucket_name"

  exclude_database_tag = true


 # SE Cloud

 [[outputs.influxdb]]

  urls = ["https://FQDN_of_Influx_Cloud:8086"]

  database = "database_name_to_write_to"

  username = "my_username"

  password = "my_password"

  timeout = "30s"


 # Cloud 2 instance

 [[outputs.influxdb_v2]]

  urls = ["https://FQDN_of_Influx_Cloud_2"]

  token = "The_Token_Generated_within_Influx_Cloud_2"

  organization = "my_registered_email_address_on_Influx_Cloud_2"

  bucket = "my_bucket_to_write_to"
As this is a LXC container, and I want to monitor all my containers, I should add a set of OS monitoring configurations. I shouldn't enable SMART monitoring or temperature monitoring, as those should come from the underlying server on which I'm running the container
/etc/telegraf/telegraf.d/cpu.conf
 # Read metrics about disk usage by mount point
 # Read metrics about cpu usage

 [[inputs.cpu]]

  ## Whether to report per-cpu stats or not

  percpu = true

  ## Whether to report total system cpu stats or not

  totalcpu = true

  ## If true, collect raw CPU time metrics.

  collect_cpu_time = false

  ## If true, compute and report the sum of all non-idle CPU states.

  report_active = false
/etc/telegraf/telegraf.d/disk.conf
 # Read metrics about disk usage by mount point

 [[inputs.disk]]

  ignore_fs = ["tmpfs", "devtmpfs", "devfs", "iso9660", "overlay", "aufs", "squashfs"]


 # Read metrics about disk IO by device

 [[inputs.diskio]]
/etc/telegraf/telegraf.d/internal.conf
 # Collect statistics about itself

 [[inputs.internal]]

  ## If true, collect telegraf memory stats.

  collect_memstats = true
/etc/telegraf/telegraf.d/kernel.conf
 [[inputs.kernel]]

  # no configuration
/etc/telegraf/telegraf.d/mem.conf
 # Read metrics about memory usage

 [[inputs.mem]]

  # no configuration
/etc/telegraf/telegraf.d/net.conf
 # Read metrics about network interface usage

 [[inputs.net]]
/etc/telegraf/telegraf.d/processes.conf
 # Get the number of processes and group them by status

 [[inputs.processes]]

  # no configuration
/etc/telegraf/telegraf.d/swap.conf
 # Read metrics about swap memory usage

 [[inputs.swap]]

  # no configuration
/etc/telegraf/telegraf.d/system.conf
 # Read metrics about system load & uptime

 [[inputs.system]]

  ## Uncomment to remove deprecated metrics.

  # fielddrop = ["uptime_format"]
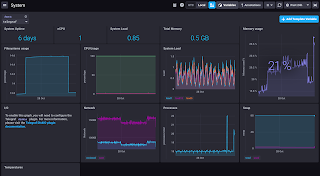
So now Telegraf will write to all three of my outputs, collating data from all three of the types of input I have (Telegraf, HTTP custom endpoint, UDP).
This is what it looks like in Chronograf, showing a system view:


Comments
Post a Comment