Server Virtualization
When I worked for Oracle, I adminstered our team's ESXi server. It was ok. When I wanted to separate server applications at home, I decided to do something similar. I looked around to see what server virtualization platforms were available, and found Proxmox. It appeared to do what ESXi did, with the addition of OpenVZ machines, which looked more like chroot jails, so I thought I'd give that a go.
Over the years, Proxmox replaced OpenVZ with LXC containers, so I moved my VMs to that technology.
More recently, Docker was announced and released as the next big thing. I took a look, but I saw no benefits over LXC and a bunch of extra command-line hassle, harking back to chroot jails, so I decided to stick with LXC.
Proxmox gives me automated regular backups, and I tend to implement turnkeylinux containers, so I get regular emails reporting my backup status and apt updates.
More recent versions of Proxmox (from v4, I believe) have the ability to write metrics to external stores over UDP, and InfluxDB is one of those. Of course, I wouldn't be able to write UDP to a cloud instance of InfluxDB, so I need to use my Telegraf Gateway to convert from UDP to HTTP.
The Proxmox documentation doesn't mention what metrics are exposed over this link, so I decided to write to my local InfluxDB instance over UDP into a new database in order to see what's available, and then replicate any visualization to my cloud instance:
/etc/pve/status.cfg
This is a view of what's available to be visualized from the Proxmox UDP link:
I don't want to directly replicate the Proxmox UI visualization. I want more of an overview in Chronograf, so this is the visualization I've created from those metrics:
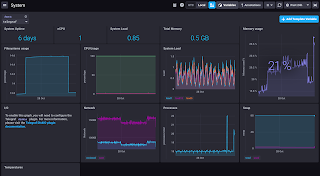
Of course, as I have Telegraf installed on the Proxmox server, I get all the regular server metrics available for visualization. One thing I noticed is that the regular "System" dashboard displays all temperature values. This includes "crit" and "max" settings, which are static values set in my BIOS, so I added regex filters to remove those values from the "Temperatures" cell, like this:
This gives me this server visualization, to partner the VM visualization above:
Over the years, Proxmox replaced OpenVZ with LXC containers, so I moved my VMs to that technology.
More recently, Docker was announced and released as the next big thing. I took a look, but I saw no benefits over LXC and a bunch of extra command-line hassle, harking back to chroot jails, so I decided to stick with LXC.
Proxmox gives me automated regular backups, and I tend to implement turnkeylinux containers, so I get regular emails reporting my backup status and apt updates.
More recent versions of Proxmox (from v4, I believe) have the ability to write metrics to external stores over UDP, and InfluxDB is one of those. Of course, I wouldn't be able to write UDP to a cloud instance of InfluxDB, so I need to use my Telegraf Gateway to convert from UDP to HTTP.
The Proxmox documentation doesn't mention what metrics are exposed over this link, so I decided to write to my local InfluxDB instance over UDP into a new database in order to see what's available, and then replicate any visualization to my cloud instance:
/etc/pve/status.cfg
 influxdb: influxdb
  server IPAddressOfLocalInfluxDBinstance
  port 8089

 influxdb: telegraf
  server IPAddressOfMyTelegrafGateway
  port 8089
This is a view of what's available to be visualized from the Proxmox UDP link:
I don't want to directly replicate the Proxmox UI visualization. I want more of an overview in Chronograf, so this is the visualization I've created from those metrics:
Of course, as I have Telegraf installed on the Proxmox server, I get all the regular server metrics available for visualization. One thing I noticed is that the regular "System" dashboard displays all temperature values. This includes "crit" and "max" settings, which are static values set in my BIOS, so I added regex filters to remove those values from the "Temperatures" cell, like this:
SELECT mean("temp") AS "mean" FROM "telegraf"."autogen"."temp" WHERE time > :dashboardTime: AND "host"=:host: AND "sensor" !~ /crit$|max$|critalarm$/ GROUP BY time(:interval:), "sensor" FILL(null)
This gives me this server visualization, to partner the VM visualization above:


Comments
Post a Comment