Which MQTT broker to select
When configuring my home automation systems, I wanted to have a message bus. In my work, I use & configure MQ-Series, various JMS systems, and AMQP, so selecting one shouldn't be too difficult. My requirements are:
So I tried HiveMQ. No admin interface or observability.
What is it with this consumer-grade software? Give me the ability to monitor & manage my ESB!
I woke with a start at 3am! I know all about Apache ActiveMQ, and I know it supports MQTT clients on the same topics as JMS clients! It also has a JMX monitoring API, and a web interface for looking at queues and topics!
I install ActiveMQ and configure it for JMX (Jolokia-2 monitoring is installed with ActiveMQ, and just needs enabling).
I configure Telegraf to read ActiveMQ & Jolokia-2 along with all the regular server metrics
/etc/telegraf/telegraf.d/activemq.conf
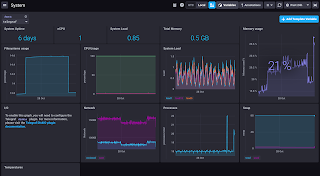
What's a really simple visualization for this, to see server stats, MQTT enqueue stats and MQTT queue size?
Well, I can't just output raw values for the enqueue count and queue size, because those statistics are cumulative. I'll need non-negative derivative functions. Fortunately, this is covered in InfluxDB:
What do my topics look like in the ActiveMQ admin website? Here's a snippet:
- It must support protocols used in home automation and IoT
- MQTT
- It must have an admin interface
- I want to see how many consumers I have per topic
- I want to see if I make a mistake in naming a queue, such as writing to SmartThings instead of smartthings
- It must be observable
- I want to see if a topic is receiving more messages than are being consumed
- I want to see the queue size
So I tried HiveMQ. No admin interface or observability.
What is it with this consumer-grade software? Give me the ability to monitor & manage my ESB!
I woke with a start at 3am! I know all about Apache ActiveMQ, and I know it supports MQTT clients on the same topics as JMS clients! It also has a JMX monitoring API, and a web interface for looking at queues and topics!
I install ActiveMQ and configure it for JMX (Jolokia-2 monitoring is installed with ActiveMQ, and just needs enabling).
I configure Telegraf to read ActiveMQ & Jolokia-2 along with all the regular server metrics
/etc/telegraf/telegraf.d/activemq.conf
 # # Gather ActiveMQ metrics
 [[inputs.activemq]]
  ## Required ActiveMQ Endpoint
  server = "IPAddressOfMyActiveMQinstance"

  ## Required ActiveMQ port
  port = 8161

  ## Credentials for basic HTTP authentication
  username = "myActiveMQusername"
  password = "myActiveMQpassword"

  ## Required ActiveMQ webadmin root path
  webadmin = "admin"

  ## Maximum time to receive response.
  response_timeout = "5s"

 [[inputs.jolokia2_agent]]
  urls = ["http://localhost:8161/api/jolokia"]
  name_prefix = "activemq."
  username = "myActiveMQusername"
  password = "myActiveMQpassword"

  [[inputs.jolokia2_agent.metric]]
   name = "OperatingSystem"
   mbean = "java.lang:type=OperatingSystem"
   paths = ["ProcessCpuLoad","SystemLoadAverage","SystemCpuLoad"]

  [[inputs.jolokia2_agent.metric]]
   name = "jvm_runtime"
   mbean = "java.lang:type=Runtime"
   paths = ["Uptime"]

  [[inputs.jolokia2_agent.metric]]
   name = "jvm_memory"
   mbean = "java.lang:type=Memory"
   paths = ["HeapMemoryUsage", "NonHeapMemoryUsage", "ObjectPendingFinalizationCount"]

  [[inputs.jolokia2_agent.metric]]
   name   = "jvm_garbage_collector"
   mbean  = "java.lang:name=*,type=GarbageCollector"
   paths  = ["CollectionTime", "CollectionCount"]
   tag_keys = ["name"]

  [[inputs.jolokia2_agent.metric]]
   name    = "jvm_memory_pool"
   mbean   = "java.lang:name=*,type=MemoryPool"
   paths   = ["Usage", "PeakUsage", "CollectionUsage"]
   tag_keys  = ["name"]
   tag_prefix = "pool_"

  [[inputs.jolokia2_agent.metric]]
   name   = "queue"
   mbean  = "org.apache.activemq:brokerName=*,destinationName=*,destinationType=Queue,type=Broker"
   paths  = ["QueueSize","EnqueueCount","ConsumerCount","DispatchCount","DequeueCount","ProducerCount","InFlightCount"]
   tag_keys = ["brokerName","destinationName"]

  [[inputs.jolokia2_agent.metric]]
   name   = "topic"
   mbean  = "org.apache.activemq:brokerName=*,destinationName=*,destinationType=Topic,type=Broker"
   paths  = ["ProducerCount","DequeueCount","ConsumerCount","QueueSize","EnqueueCount"]
   tag_keys = ["brokerName","destinationName"]

  [[inputs.jolokia2_agent.metric]]
   name   = "broker"
   mbean  = "org.apache.activemq:brokerName=*,type=Broker"
   paths  = ["TotalConsumerCount","TotalMessageCount","TotalEnqueueCount","TotalDequeueCount","MemoryLimit","MemoryPercentUsage","StoreLimit","StorePercentUsage","TempPercentUsage","TempLimit"]
   tag_keys = ["brokerName"]
What's a really simple visualization for this, to see server stats, MQTT enqueue stats and MQTT queue size?
Well, I can't just output raw values for the enqueue count and queue size, because those statistics are cumulative. I'll need non-negative derivative functions. Fortunately, this is covered in InfluxDB:
SELECT non_negative_derivative(mean("EnqueueCount")) AS "EnqueueCount", non_negative_derivative(mean("QueueSize")) AS "QueueSize" FROM "telegraf"."autogen"."activemq.topic" WHERE time > :dashboardTime: GROUP BY time(:interval:) FILL(null)
What do my topics look like in the ActiveMQ admin website? Here's a snippet:


Comments
Post a Comment